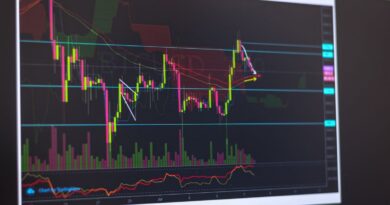
XRP Hits All-Time High Before Forming Bearish Double Top Pattern, Ether Prints ‘Doji’
Crypto Market Analysis: Ether, XRP, Bitcoin, and Solana
This report provides a technical analysis of prominent cryptocurrencies, focusing on Ether (ETH), XRP, Bitcoin (BTC), and Solana (SOL), incorporating key price patterns and indicators.
Ether (ETH): Indecision and Potential Pullback
Ether’s Doji candle on Monday indicates market uncertainty following a rapid price increase. The $3,859 high acts as crucial resistance. The $3,800-$4,100 range represents a historical resistance zone. A breakdown of a head-and-shoulders pattern on the 15-minute chart suggests a potential drop to $3,550. The hourly chart’s breach below the Ichimoku cloud reinforces a bearish momentum shift. Traders should monitor whether ETH decisively breaks above the $3,800-$4,100 range or experiences a pullback. Resistance levels are $4,000, $4,109, and $4,382; support levels are $3,480, $3,081, and $2,879.
XRP: Double Top Formation and Bearish Signals
XRP has traded sideways, capped above $3.6 and supported around $3.35. The hourly chart shows a double top pattern, a bearish reversal signal. A break below $3.35 could trigger a pullback to $3. The bearish Guppy Multiple Moving Average (GMMA) on the hourly chart increases the likelihood of a double top breakdown. However, a decisive move above $3.65 would signal continued bullish momentum. Despite the constructive broader outlook, caution is warranted due to the double top and bearish GMMA. Resistance levels are $3.65 and $4; support levels are $3.35, $3, and $2.65.
Bitcoin (BTC): Descending Triangle Consolidation
Bitcoin continues consolidating within a descending triangle pattern. Breaking above the upper trendline could lead to a rally above $123,000. Conversely, a downside break increases the risk of a deeper pullback, with significant support at $111,965. Bitcoin is at a crucial juncture, with its future direction heavily dependent on a decisive break of key price levels. Resistance levels are $120,000 and $123,181; support levels are $116,000, $115,739, and $111,965.
Solana (SOL): Pullback from Highs
Solana has pulled back to $194 from its five-month high of $204. A long upper wick on the daily candle suggests seller pressure. Bearish momentum indicators, like the hourly MACD, indicate potential for further decline toward $185. Despite the short-term pullback, the broader outlook remains positive as prices are above the daily Ichimoku cloud and within an ascending channel. Resistance levels are $204, $218, and $252-$264.