NEW YORK, Sept. 28, 2022 /PRNewswire/ — The NFT Market report has been added to Technavio’s offering. With ISO 9001:2015 certification, Technavio is proudly partnering with more than 100 Fortune 500 companies for over 16 years. The potential growth difference for the NFT market between 2021 and 2026 is USD 147.24 bn. To get the exact yearly growth variance and the Y-O-Y growth rate, Buy Sample Report.
Parent Market Analysis
Technavio categorizes the global non-fungible token (NFT) market as a part of the global systems software market within the global Information Technology market. External factors influencing the parent market’s growth potential in the coming years have been thoroughly investigated in our research analysis.
NonFfungible Token (NFT) Market Value Chain Analysis
The end-to-end understanding of the value chain is essential in profit margin optimization and evaluation of business strategies. The data available in our value chain analysis segment can help vendors drive costs and enhance customer services during the forecast period.
The value chain of the non-fungible token (NFT) market includes the following core components:
Inputs
Inbound logistics
Operations
Outbound logistics
Marketing and sales
Innovation
To unlock information about vendor drive costs and customer service, download our free sample report.
Key Market Dynamics:
Market Driver
Market Challenges
The rising demand for digital artworks is one of the major drivers propelling the growth of the non-fungible token (NFT) industry globally. Through the Internet, social media, and other digital platforms, NFT has become more popular in digital creative applications worldwide. The owner or the artist can then decide on a fair price for the NFT artworks.
The end-user will then receive the key as proof of possession. The purchase turnaround time can be shortened by directly selling artwork using virtual platforms using the tokens. As a result, these elements are boosting demand for the worldwide NFT market. However, factors like the NFT market’s unpredictability could limit market expansion.
The non-fungible token (NFT) market share rise by the collectibles segment will be large. The global increase in demand for digital assets is a crucial factor in the collectible segment. The majority of sectors now sell their products exclusively online.
The near universality of the Internet, the pervasiveness of mobile devices, and the growth in Internet usage have prompted businesses to broaden their product lines and make investments in digital assets. NFT collectibles are sold by a number of retailers, including Funko Inc., Foundation, and Makersplace.
Some Companies Mentioned with their Offerings
To gain access to more vendor profiles with their key offerings available with Technavio, Click Here
Related Reports:
Enterprise AI Market by End-user, Deployment, and Geography – Forecast and Analysis 2022-2026
Virtual Desktop Infrastructure (VDI) Market Research Report, Size, Growth, Trends, Opportunity Analysis, Industry Forecast – 2022-2026
NFT Market Scope
Report Coverage
Details
Page number
120
Base year
2021
Forecast period
2022-2026
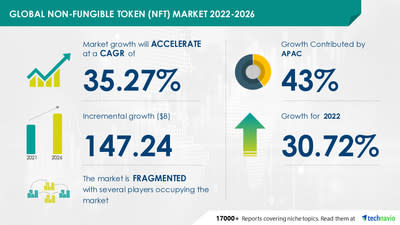
Growth momentum & CAGR
Accelerate at a CAGR of 35.27%
Market growth 2022-2026
$147.24 billion
Market structure
Fragmented
YoY growth (%)
30.72
Regional analysis
APAC, South America, Middle East and Africa, North America, and Europe
Performing market contribution
APAC at 43%
Key consumer countries
United Arab Emirates, Singapore, China, The Philippines, and Venezuela
Competitive landscape
Leading companies, competitive strategies, consumer engagement scope
Companies profiled
Asynchronous Art Inc., Binance Services Holdings Ltd., Dapper Labs Inc., Decentraland Foundation, Enjin Pte. Ltd., Foundation Labs Inc., FTX Trading Ltd., Funko Inc., Gala Games, Gemini Trust Co. LLC, Mintable.app, Mobox Digital Co. Ltd., Onchain Labs Inc., OpenSea, Rarible Inc., Sorare SAS, SuperRare Labs Inc., Theta Labs Inc., Yellowheart LLC, and Yuga Labs LLC
Market Dynamics
Parent market analysis, Market growth inducers and obstacles, Fast-growing and slow-growing segment analysis, COVID-19 impact and future consumer dynamics, and market condition analysis for the forecast period.
Customization purview
If our report has not included the data that you are looking for, you can reach out to our analysts and get segments customized.
Table of Contents
1. Executive Summary
1.1 Market Overview
Exhibit 01: Executive Summary – Chart on Market Overview
Exhibit 02: Executive Summary – Data Table on Market Overview
Exhibit 03: Executive Summary – Chart on Global Market Characteristics
Exhibit 04: Executive Summary – Chart on Market by Geography
Exhibit 05: Executive Summary – Chart on Market Segmentation by Application
Exhibit 06: Executive Summary – Chart on Incremental Growth
Exhibit 07: Executive Summary – Data Table on Incremental Growth
Exhibit 08: Executive Summary – Chart on Vendor Market Positioning
2. Market Landscape
2.1 Market ecosystem
Exhibit 09: Parent market
Exhibit 10: Market characteristics
3. Market Sizing
3.1 Market definition
Exhibit 11: Offerings of vendors included in the market definition
3.2 Market segment analysis
Exhibit 12: Market segments
3.3 Market size 2021
3.4 Market outlook: Forecast for 2021 – 2026
Exhibit 13: Chart on Global – Market size and forecast 2021-2026 ($ billion)
Exhibit 14: Data Table on Global – Market size and forecast 2021-2026 ($ billion)
Exhibit 15: Chart on Global Market: Year-over-year growth 2021-2026 (%)
Exhibit 16: Data Table on Global Market: Year-over-year growth 2021-2026 (%)
4. Five Forces Analysis
4.1 Five Forces Summary
Exhibit 17: Five forces analysis – Comparison between 2021 and 2026
4.2 Bargaining power of buyers
Exhibit 18: Bargaining power of buyers – Impact of key factors in 2021 and 2026
4.3 Bargaining power of suppliers
Exhibit 19: Bargaining power of suppliers – Impact of key factors in 2021 and 2026
4.4 Threat of new entrants
Exhibit 20: Threat of new entrants – Impact of key factors in 2021 and 2026
4.5 Threat of substitutes
Exhibit 21: Threat of substitutes – Impact of key factors in 2021 and 2026
4.6 Threat of rivalry
Exhibit 22: Threat of rivalry – Impact of key factors in 2021 and 2026
4.7 Market condition
Exhibit 23: Chart on Market condition – Five forces 2021 and 2026
5 Market Segmentation by Application
5.1 Market segments
Exhibit 24: Chart on Application – Market share 2021-2026 (%)
Exhibit 25: Data Table on Application – Market share 2021-2026 (%)
5.2 Comparison by Application
Exhibit 26: Chart on Comparison by Application
Exhibit 27: Data Table on Comparison by Application
5.3 Collectibles – Market size and forecast 2021-2026
Exhibit 28: Chart on Collectibles – Market size and forecast 2021-2026 ($ billion)
Exhibit 29: Data Table on Collectibles – Market size and forecast 2021-2026 ($ billion)
Exhibit 30: Chart on Collectibles – Year-over-year growth 2021-2026 (%)
Exhibit 31: Data Table on Collectibles – Year-over-year growth 2021-2026 (%)
5.4 Sports – Market size and forecast 2021-2026
Exhibit 32: Chart on Sports – Market size and forecast 2021-2026 ($ billion)
Exhibit 33: Data Table on Sports – Market size and forecast 2021-2026 ($ billion)
Exhibit 34: Chart on Sports – Year-over-year growth 2021-2026 (%)
Exhibit 35: Data Table on Sports – Year-over-year growth 2021-2026 (%)
5.5 Arts – Market size and forecast 2021-2026
Exhibit 36: Chart on Arts – Market size and forecast 2021-2026 ($ billion)
Exhibit 37: Data Table on Arts – Market size and forecast 2021-2026 ($ billion)
Exhibit 38: Chart on Arts – Year-over-year growth 2021-2026 (%)
Exhibit 39: Data Table on Arts – Year-over-year growth 2021-2026 (%)
5.6 Others – Market size and forecast 2021-2026
Exhibit 40: Chart on Others – Market size and forecast 2021-2026 ($ billion)
Exhibit 41: Data Table on Others – Market size and forecast 2021-2026 ($ billion)
Exhibit 42: Chart on Others – Year-over-year growth 2021-2026 (%)
Exhibit 43: Data Table on Others – Year-over-year growth 2021-2026 (%)
5.7 Market opportunity by Application
Exhibit 44: Market opportunity by Application ($ billion)
6. Customer landscape
6.1 Customer landscape overview
Technavio’s customer landscape matrix comparing Drivers or price sensitivity, Adoption lifecycle, importance in customer price basket, Adoption rate and Key purchase criteria
Exhibit 45: Analysis of price sensitivity, lifecycle, customer purchase basket, adoption rates, and purchase criteria
7. Geographic Landscape
7.1 Geographic segmentation
Exhibit 46: Chart on Market share by geography 2021-2026 (%)
Exhibit 47: Data Table on Market share by geography 2021-2026 (%)
7.2 Geographic comparison
Exhibit 48: Chart on Geographic comparison
Exhibit 49: Data Table on Geographic comparison
7.3 APAC – Market size and forecast 2021-2026
Exhibit 50: Chart on APAC – Market size and forecast 2021-2026 ($ billion)
Exhibit 51: Data Table on APAC – Market size and forecast 2021-2026 ($ billion)
Exhibit 52: Chart on APAC – Year-over-year growth 2021-2026 (%)
Exhibit 53: Data Table on APAC – Year-over-year growth 2021-2026 (%)
7.4 South America – Market size and forecast 2021-2026
Exhibit 54: Chart on South America – Market size and forecast 2021-2026 ($ billion)
Exhibit 55: Data Table on South America – Market size and forecast 2021-2026 ($ billion)
Exhibit 56: Chart on South America – Year-over-year growth 2021-2026 (%)
Exhibit 57: Data Table on South America – Year-over-year growth 2021-2026 (%)
7.5 Middle East and Africa – Market size and forecast 2021-2026
Exhibit 58: Chart on Middle East and Africa – Market size and forecast 2021-2026 ($ billion)
Exhibit 59: Data Table on Middle East and Africa – Market size and forecast 2021-2026 ($ billion)
Exhibit 60: Chart on Middle East and Africa – Year-over-year growth 2021-2026 (%)
Exhibit 61: Data Table on Middle East and Africa – Year-over-year growth 2021-2026 (%)
7.6 North America – Market size and forecast 2021-2026
Exhibit 62: Chart on North America – Market size and forecast 2021-2026 ($ billion)
Exhibit 63: Data Table on North America – Market size and forecast 2021-2026 ($ billion)
Exhibit 64: Chart on North America – Year-over-year growth 2021-2026 (%)
Exhibit 65: Data Table on North America – Year-over-year growth 2021-2026 (%)
7.7 Europe – Market size and forecast 2021-2026
Exhibit 66: Chart on Europe – Market size and forecast 2021-2026 ($ billion)
Exhibit 67: Data Table on Europe – Market size and forecast 2021-2026 ($ billion)
Exhibit 68: Chart on Europe – Year-over-year growth 2021-2026 (%)
Exhibit 69: Data Table on Europe – Year-over-year growth 2021-2026 (%)
7.8 Singapore – Market size and forecast 2021-2026
Exhibit 70: Chart on Singapore – Market size and forecast 2021-2026 ($ billion)
Exhibit 71: Data Table on Singapore – Market size and forecast 2021-2026 ($ billion)
Exhibit 72: Chart on Singapore – Year-over-year growth 2021-2026 (%)
Exhibit 73: Data Table on Singapore – Year-over-year growth 2021-2026 (%)
7.9 China – Market size and forecast 2021-2026
Exhibit 74: Chart on China – Market size and forecast 2021-2026 ($ billion)
Exhibit 75: Data Table on China – Market size and forecast 2021-2026 ($ billion)
Exhibit 76: Chart on China – Year-over-year growth 2021-2026 (%)
Exhibit 77: Data Table on China – Year-over-year growth 2021-2026 (%)
7.10 Venezuela – Market size and forecast 2021-2026
Exhibit 78: Chart on Venezuela – Market size and forecast 2021-2026 ($ billion)
Exhibit 79: Data Table on Venezuela – Market size and forecast 2021-2026 ($ billion)
Exhibit 80: Chart on Venezuela – Year-over-year growth 2021-2026 (%)
Exhibit 81: Data Table on Venezuela – Year-over-year growth 2021-2026 (%)
7.11 The Philippines – Market size and forecast 2021-2026
Exhibit 82: Chart on The Philippines – Market size and forecast 2021-2026 ($ billion)
Exhibit 83: Data Table on The Philippines – Market size and forecast 2021-2026 ($ billion)
Exhibit 84: Chart on The Philippines – Year-over-year growth 2021-2026 (%)
Exhibit 85: Data Table on The Philippines – Year-over-year growth 2021-2026 (%)
7.12 United Arab Emirates – Market size and forecast 2021-2026
Exhibit 86: Chart on United Arab Emirates – Market size and forecast 2021-2026 ($ billion)
Exhibit 87: Data Table on United Arab Emirates – Market size and forecast 2021-2026 ($ billion)
Exhibit 88: Chart on United Arab Emirates – Year-over-year growth 2021-2026 (%)
Exhibit 89: Data Table on United Arab Emirates – Year-over-year growth 2021-2026 (%)
7.13 Market opportunity by geography
Exhibit 90: Market opportunity by geography ($ billion)
8. Drivers, Challenges, and Trends
8.1 Market drivers
8.1.1 Increasing demand for digital artworks
8.1.2 Growing investment in digital assets
8.1.3 Security and ownership of digital assets
8.2 Market challenges
8.2.1 Uncertainty of the NFT market
8.2.2 Threat from cyberattacks
8.2.3 Legal and regulatory challenges associated with the NFT market
8.3 Impact of drivers and challenges
Exhibit 91: Impact of drivers and challenges in 2021 and 2026
8.4 Market trends
8.4.1 Growing number of big brands entering the market
8.4.2 Emergence of fractionalized NFTs
8.4.3 Growing application of AI in the market
9. Vendor Landscape
9.1 Overview
9.2 Vendor landscape
Exhibit 92: Overview on Criticality of inputs and Factors of differentiation
The potential for the disruption of the market landscape was moderate in 2020, and its threat is expected to remain unchanged by 2025.
9.3 Landscape disruption
Exhibit 93: Overview on factors of disruption
9.4 Industry risks
Exhibit 94: Impact of key risks on business
10. Vendor Analysis
10.1 Vendors covered
Exhibit 95: Vendors covered
10.2 Market positioning of vendors
Exhibit 96: Matrix on vendor position and classification
10.3 Binance Services Holdings Ltd.
Exhibit 97: Binance Services Holdings Ltd. – Overview
Exhibit 98: Binance Services Holdings Ltd. – Product / Service
Exhibit 99: Binance Services Holdings Ltd. – Key offerings
10.4 Dapper Labs Inc.
Exhibit 100: Dapper Labs Inc. – Overview
Exhibit 101: Dapper Labs Inc. – Product / Service
Exhibit 102: Dapper Labs Inc. – Key offerings
10.5 Decentraland Foundation
Exhibit 103: Decentraland Foundation – Overview
Exhibit 104: Decentraland Foundation – Product / Service
Exhibit 105: Decentraland Foundation – Key offerings
10.6 FTX Trading Ltd.
Exhibit 106: FTX Trading Ltd. – Overview
Exhibit 107: FTX Trading Ltd. – Product / Service
Exhibit 108: FTX Trading Ltd. – Key offerings
10.7 Funko Inc.
Exhibit 109: Funko Inc. – Overview
Exhibit 110: Funko Inc. – Product / Service
Exhibit 111: Funko Inc. – Key news
Exhibit 112: Funko Inc. – Key offerings
10.8 Gemini Trust Co. LLC
Exhibit 113: Gemini Trust Co. LLC – Overview
Exhibit 114: Gemini Trust Co. LLC – Product / Service
About Us
Technavio is a leading global technology research and advisory company. Their research and analysis focuses on emerging market trends and provides actionable insights to help businesses identify market opportunities and develop effective strategies to optimize their market positions.
With over 500 specialized analysts, Technavio’s report library consists of more than 17,000 reports and counting, covering 800 technologies, spanning across 50 countries. Their client base consists of enterprises of all sizes, including more than 100 Fortune 500 companies. This growing client base relies on Technavio’s comprehensive coverage, extensive research, and actionable market insights to identify opportunities in existing and potential markets and assess their competitive positions within changing market scenarios.
Contact
Technavio Research
Jesse Maida
Media & Marketing Executive
US: +1 844 364 1100
UK: +44 203 893 3200
Email:media@technavio.com
Website: www.technavio.com/
View original content to download multimedia:https://www.prnewswire.com/news-releases/nft-market-2026-increasing-demand-for-digital-artworks-to-boost-market-growth—technavio-301634383.html
SOURCE Technavio
New Project Baby Villains Looking to Shake Up the NFT Industry
The restaurant chain is the latest to introduce a subscription model. It isn't the only one.
General Motors CEO Mary Barra yesterday apologized to salaried workers for the timing of a memo sent late Friday afternoon outlining a new back-to-office policy and delayed the implementation of the plan. The email said that GM employees who had been working remotely during the pandemic would be required later this year to return to the office at least three days a week, the Detroit Free Press reported. The email triggered employee pushback about both the updated policy and the timing of the announcement, leading Barra to partially walk back the decision, announcing Tuesday that the automaker will not implement the requirement this year but that “a more regular, in-person presence” will still be the plan for the future.
Motley Fool contributor Jason Hall talks about why he owns QuantumScape (NYSE: QS) stock. This battery technology innovator could hold the key to solid-state batteries. Find out what these groundbreaking batteries could mean for electric vehicles and more in the video.
A brand long associated with being a 'value' choice now commands the biggest markup over its showroom sticker price.
(Bloomberg) — Amazon.com Inc. announced a pay increase for hourly workers in the US that it says will take average starting wage for most front-line employees in warehousing and transportation to more than $19 an hour.Most Read from BloombergMacKenzie Scott Files for Divorce From Science Teacher HusbandTrump Refuses to Delay Florida Deposition in Phone-Fraud Case Despite HurricaneApple Ditches iPhone Production Increase After Demand FaltersStocks Plummet to 22-Month Low as Fed Hawks Circle: Mar
Yahoo Finance Live anchor Seana Smith details a new report that Meta is planning to cut costs, freeze hiring, and restructure its teams.
Tesla's billionaire CEO is resentful, never failing to remind his opponents of their past battles.
Illumina, a leading maker of gene-sequencing systems, announced faster, cheaper gene-readers Thursday.
(Bloomberg) — Chinese companies are flailing in a fresh bid to avoid being booted off US stock exchanges for shirking Washington’s oversight demands. Most Read from BloombergMacKenzie Scott Files for Divorce From Science Teacher HusbandTrump Refuses to Delay Florida Deposition in Phone-Fraud Case Despite HurricaneApple Ditches iPhone Production Increase After Demand FaltersStocks Plummet to 22-Month Low as Fed Hawks Circle: Markets WrapMeta to Cut Headcount for First Time, Slash Budgets Across
Warren Buffett owns nearly 20% of Occidental Petroleum after a July buying spree. But is it a good investment?
The benchmark S&P 500, which is typically viewed as the best barometer of stock market health, produced its worst first-half return in 52 years. As for the growth-driven Nasdaq Composite, an index largely responsible for pushing the stock market to new highs, it's lost about a third of its value. This puts both the S&P 500 and Nasdaq firmly in a bear market.
Best Buy has a fairly unique story in the retail world. The electronics chain appeared to be on its way toward bankruptcy when it made the unconventional choice to hire Hubert Joly — an executive with a hospitality background — to take over the chain. At the time, that move seemed like a misstep, but it turned out to be one of the best hires it retail history.
Bankers texting away on their personal phones are costing the biggest banks on Wall Street chunk of money.
Part of a sound retirement planning strategy involves choosing the best age to retire. The normal retirement age is typically 65 or 66 for most people; this is when you can begin drawing your full Social Security retirement benefit. It … Continue reading → The post What Are the Best Ages to Retire? appeared first on SmartAsset Blog.
(Reuters) -Used-car retailer CarMax Inc said on Thursday that an uncertain economic environment was starting to take a toll on vehicle demand, sending ripples through the auto sector, which has largely dodged a significant hit from inflation this year. CarMax shares tumbled 22% to $66.63 to hit a more than two-year low, after the company reported second-quarter results below analysts' estimates and underscored the impact of inflation and rising interest rates on car sales. "Obviously, consumers are having to make decisions … I just think they are prioritizing their spend a little differently," Chief Executive Officer William Nash told analysts, adding that softness in used-car sales continued in September.
There's no denying Warren Buffett is the greatest living investor. Berkshire Hathaway has generated better than 20% compounded annual returns since 1965. Although Buffett's performance in recent years has been well below that (about 8% a year over the past five years), it's his consistency over time that has attracted legions of investors to follow him.
After a decade of explosive growth, the company formerly known as Facebook is planning to trim down. Bloomberg reports that Meta CEO Mark Zuckerberg announced plans to freeze hiring and restructure some groups within the company Thursday in an internal all-hands call. According to Bloomberg, Meta plans to shrink budgets widely within the company, including to teams that it was recently investing in.
Bullish and bearish catalysts are battling it out in the oil market, but macro factors could win out and bring oil back to the $100 level
Exxon Mobil issued a temporary "stand-down" across its U.S. shale operations last week following back-to-back worker injuries, including one fatality, according to people familiar with the matter. The incidents, one of which marked the second death this year of a contractor, comes at a turning point for oilfield service firms straining to hire workers to restart some operations. The stand-down follows two worker accidents within days at production sites run by Exxon's shale unit and comes as Exxon is facing multiple negligence lawsuits.
Skip to content
Skip to sidebar
Skip to footer


0 items
-
$0.00
0