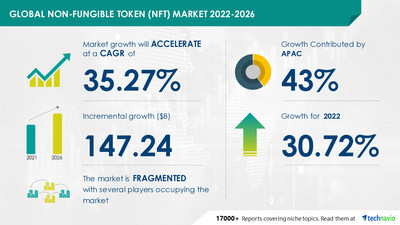
NEW YORK, Nov. 9, 2022 /PRNewswire/ — The non-fungible token (NFT) market size is expected to grow by USD 147.24 billion and accelerate at a CAGR of 35.27% between 2021 and 2026. The report provides a comprehensive analysis of the current market scenario, YOY growth rates, revenue-generating segments, regional growth opportunities, product launches, and vendor landscape among others. Asynchronous Art Inc., Binance Services Holdings Ltd., Dapper Labs Inc., Decentraland Foundation, and Enjin Pte. Ltd. are identified as some of the key vendors in the market. Download Free PDF Sample Report
Non-Fungible Token (NFT) Market 2022-2026: Scope
Technavio presents a detailed picture of the market by way of study, synthesis, and summation of data from multiple sources. Our non-fungible token (NFT) market report covers the following areas:
Non-Fungible Token (NFT) Market Size
Non-Fungible Token (NFT) Market Trends
Non-Fungible Token (NFT) Market Industry Analysis
Non-Fungible Token (NFT) Market 2022-2026: Vendor Analysis
We provide a detailed analysis of around 25 vendors operating in the non-fungible token (NFT) market. Backed with competitive intelligence and benchmarking, our research report on the non-fungible token (NFT) market is designed to provide entry support, customer profile, and M&As as well as go-to-market strategy support. Technavio identifies the following as the key vendors in the market:
Binance Services Holdings Ltd.: The company offers a wide range of non-fungible tokens such as Alien Worlds Binance Mission, Bored Pixel EN, Freaky Mandrill Ape, Legendary X Squid GAME, and The Virgin Mary. Edition 17.
Dapper Labs Inc.: The company offers non-fungible tokens namely NBA Top Shot.
Decentraland Foundation: The company offers a wide range of non-fungible tokens such as AustinDCL Security Helmet, Blockchain Camouflage Guardian, Stick Woman, and Energy.
FTX Trading Ltd.: The company offers nonfungible tokens for Animals Retro Art, FTX Special, Landscapes, Contemporary Art, and FTX Swag.
Funko Inc.: The company offers non-fungible tokens such as Scooby doo X Funko, Transformers X Funko, Nickelodeon Cartoons X Funko, and Retro Comics X Funko.
Asynchronous Art Inc.
Enjin Pte. Ltd.
Foundation Labs Inc.
Gala Games
Gemini Trust Co. LLC
Gain access to more vendor profiles available with Technavio. Buy Now!
Technavio’s library includes over 17,000+ reports covering more than 2,000 emerging technologies. Subscribe to our “Basic Plan” at just USD 5,000 and get lifetime access to our Technavio Insights
Non-Fungible Token (NFT) Market 2022-2026: Segmentation
The global non-fungible token (NFT) Market is segmented as below:
Application
Collectibles accounted for the highest market share in 2021. NFT collectibles are limited edition or rare NFT tokens which are minted on the blockchain. Collectibles are unique, and one collectible cannot be exchanged or traded with another collectible. The growth of the collectible segment is majorly driven by the growing demand for digital assets across the world. Additionally, the emergence of tokenization in the digital asset industry will further propel the segment’s growth.
Geography
APAC will dominate the market growth, occupying 43% of the global market share. The NFT market in APAC is expected to grow due to the growing demand for digital assets in countries like Singapore, China, South Korea, the Philippines, and Japan. Korean retail channels are expanding their footprint into the flourishing NFT business by selling art and fashion items. The NFT market in countries such as Japan is also gaining traction. Sports enterprises are showing more interest in selling NFT videos of sports events. These factors positively impacted the regional market. Identify potential segments and regions to invest in over the forecast period. Download Free Sample Report
Non-Fungible Token (NFT) Market 2022-2026: Key Highlights
CAGR of the market during the forecast period 2022-2026
Detailed information on factors that will assist non-fungible token (NFT) market growth during the next five years
Estimation of the non-fungible token (NFT) market size and its contribution to the parent market
Predictions on upcoming trends and changes in consumer behavior
The growth of the non-fungible token (NFT) market
Analysis of the market’s competitive landscape and detailed information on vendors
Comprehensive details of factors that will challenge the growth of non-fungible token (NFT) market vendors
Related Reports:
The metaverse in FMCG market share is expected to increase to USD 2.11 billion from 2021 to 2026 at an accelerating CAGR of 21.8%. The growing number of FMCG brands entering the metaverse platform is notably driving the metaverse in FMCG market growth, although factors such as privacy and security concerns over metaverse may impede the market growth.
The cryptocurrency mining hardware market report is a comprehensive research document that provides in-depth qualitative and quantitative intelligence. Technavio’s analysts estimate the market share growth of USD 12053.16 million from 2022 to 2027, at a CAGR of 11.35%. The profitability of cryptocurrency mining ventures is notably driving the cryptocurrency mining hardware market growth, although factors such as growing demand for the volatility in the value of cryptocurrency may impede the market growth.
NON-FUNGIBLE TOKEN (NFT) Market Scope
Report Coverage
Details
Page number
120
Base year
2021
Forecast period
2022-2026
Growth momentum & CAGR
Accelerate at a CAGR of 35.27%
Market growth 2022-2026
USD 147.24 billion
Market structure
Fragmented
YoY growth (%)
30.72
Regional analysis
APAC, South America, Middle East and Africa, North America, and Europe
Performing market contribution
APAC at 43%
Key consumer countries
United Arab Emirates, Singapore, China, The Philippines, and Venezuela
Competitive landscape
Leading companies, competitive strategies, consumer engagement scope
Companies profiled
Asynchronous Art Inc., Binance Services Holdings Ltd., Dapper Labs Inc., Decentraland Foundation, Enjin Pte. Ltd., Foundation Labs Inc., FTX Trading Ltd., Funko Inc., Gala Games, Gemini Trust Co. LLC, Mintable.app, Mobox Digital Co. Ltd., Onchain Labs Inc., OpenSea, Rarible Inc., Sorare SAS, SuperRare Labs Inc., Theta Labs Inc., Yellowheart LLC, and Yuga Labs LLC
Market Dynamics
Parent market analysis, Market growth inducers and obstacles, Fast-growing and slow-growing segment analysis, COVID-19 impact and future consumer dynamics, and market condition analysis for the forecast period.
Customization purview
If our report has not included the data that you are looking for, you can reach out to our analysts and get segments customized.
Table Of Contents:
1. Executive Summary
1.1 Market Overview
Exhibit 01: Executive Summary – Chart on Market Overview
Exhibit 02: Executive Summary – Data Table on Market Overview
Exhibit 03: Executive Summary – Chart on Global Market Characteristics
Exhibit 04: Executive Summary – Chart on Market by Geography
Exhibit 05: Executive Summary – Chart on Market Segmentation by Application
Exhibit 06: Executive Summary – Chart on Incremental Growth
Exhibit 07: Executive Summary – Data Table on Incremental Growth
Exhibit 08: Executive Summary – Chart on Vendor Market Positioning
2. Market Landscape
2.1 Market ecosystem
Exhibit 09: Parent market
Exhibit 10: Market characteristics
3. Market Sizing
3.1 Market definition
Exhibit 11: Offerings of vendors included in the market definition
3.2 Market segment analysis
Exhibit 12: Market segments
3.3 Market size 2021
3.4 Market outlook: Forecast for 2021 – 2026
Exhibit 13: Chart on Global – Market size and forecast 2021-2026 ($ billion)
Exhibit 14: Data Table on Global – Market size and forecast 2021-2026 ($ billion)
Exhibit 15: Chart on Global Market: Year-over-year growth 2021-2026 (%)
Exhibit 16: Data Table on Global Market: Year-over-year growth 2021-2026 (%)
4. Five Forces Analysis
4.1 Five Forces Summary
Exhibit 17: Five forces analysis – Comparison between 2021 and 2026
4.2 Bargaining power of buyers
Exhibit 18: Bargaining power of buyers – Impact of key factors in 2021 and 2026
4.3 Bargaining power of suppliers
Exhibit 19: Bargaining power of suppliers – Impact of key factors in 2021 and 2026
4.4 Threat of new entrants
Exhibit 20: Threat of new entrants – Impact of key factors in 2021 and 2026
4.5 Threat of substitutes
Exhibit 21: Threat of substitutes – Impact of key factors in 2021 and 2026
4.6 Threat of rivalry
Exhibit 22: Threat of rivalry – Impact of key factors in 2021 and 2026
4.7 Market condition
Exhibit 23: Chart on Market condition – Five forces 2021 and 2026
5 Market Segmentation by Application
5.1 Market segments
Exhibit 24: Chart on Application – Market share 2021-2026 (%)
Exhibit 25: Data Table on Application – Market share 2021-2026 (%)
5.2 Comparison by Application
Exhibit 26: Chart on Comparison by Application
Exhibit 27: Data Table on Comparison by Application
5.3 Collectibles – Market size and forecast 2021-2026
Exhibit 28: Chart on Collectibles – Market size and forecast 2021-2026 ($ billion)
Exhibit 29: Data Table on Collectibles – Market size and forecast 2021-2026 ($ billion)
Exhibit 30: Chart on Collectibles – Year-over-year growth 2021-2026 (%)
Exhibit 31: Data Table on Collectibles – Year-over-year growth 2021-2026 (%)
5.4 Sports – Market size and forecast 2021-2026
Exhibit 32: Chart on Sports – Market size and forecast 2021-2026 ($ billion)
Exhibit 33: Data Table on Sports – Market size and forecast 2021-2026 ($ billion)
Exhibit 34: Chart on Sports – Year-over-year growth 2021-2026 (%)
Exhibit 35: Data Table on Sports – Year-over-year growth 2021-2026 (%)
5.5 Arts – Market size and forecast 2021-2026
Exhibit 36: Chart on Arts – Market size and forecast 2021-2026 ($ billion)
Exhibit 37: Data Table on Arts – Market size and forecast 2021-2026 ($ billion)
Exhibit 38: Chart on Arts – Year-over-year growth 2021-2026 (%)
Exhibit 39: Data Table on Arts – Year-over-year growth 2021-2026 (%)
5.6 Others – Market size and forecast 2021-2026
Exhibit 40: Chart on Others – Market size and forecast 2021-2026 ($ billion)
Exhibit 41: Data Table on Others – Market size and forecast 2021-2026 ($ billion)
Exhibit 42: Chart on Others – Year-over-year growth 2021-2026 (%)
Exhibit 43: Data Table on Others – Year-over-year growth 2021-2026 (%)
5.7 Market opportunity by Application
Exhibit 44: Market opportunity by Application ($ billion)
6. Customer landscape
6.1 Customer landscape overview
Technavio’s customer landscape matrix comparing Drivers or price sensitivity, Adoption lifecycle, importance in customer price basket, Adoption rate and Key purchase criteria
Exhibit 45: Analysis of price sensitivity, lifecycle, customer purchase basket, adoption rates, and purchase criteria
7. Geographic Landscape
7.1 Geographic segmentation
Exhibit 46: Chart on Market share by geography 2021-2026 (%)
Exhibit 47: Data Table on Market share by geography 2021-2026 (%)
7.2 Geographic comparison
Exhibit 48: Chart on Geographic comparison
Exhibit 49: Data Table on Geographic comparison
7.3 APAC – Market size and forecast 2021-2026
Exhibit 50: Chart on APAC – Market size and forecast 2021-2026 ($ billion)
Exhibit 51: Data Table on APAC – Market size and forecast 2021-2026 ($ billion)
Exhibit 52: Chart on APAC – Year-over-year growth 2021-2026 (%)
Exhibit 53: Data Table on APAC – Year-over-year growth 2021-2026 (%)
7.4 South America – Market size and forecast 2021-2026
Exhibit 54: Chart on South America – Market size and forecast 2021-2026 ($ billion)
Exhibit 55: Data Table on South America – Market size and forecast 2021-2026 ($ billion)
Exhibit 56: Chart on South America – Year-over-year growth 2021-2026 (%)
Exhibit 57: Data Table on South America – Year-over-year growth 2021-2026 (%)
7.5 Middle East and Africa – Market size and forecast 2021-2026
Exhibit 58: Chart on Middle East and Africa – Market size and forecast 2021-2026 ($ billion)
Exhibit 59: Data Table on Middle East and Africa – Market size and forecast 2021-2026 ($ billion)
Exhibit 60: Chart on Middle East and Africa – Year-over-year growth 2021-2026 (%)
Exhibit 61: Data Table on Middle East and Africa – Year-over-year growth 2021-2026 (%)
7.6 North America – Market size and forecast 2021-2026
Exhibit 62: Chart on North America – Market size and forecast 2021-2026 ($ billion)
Exhibit 63: Data Table on North America – Market size and forecast 2021-2026 ($ billion)
Exhibit 64: Chart on North America – Year-over-year growth 2021-2026 (%)
Exhibit 65: Data Table on North America – Year-over-year growth 2021-2026 (%)
7.7 Europe – Market size and forecast 2021-2026
Exhibit 66: Chart on Europe – Market size and forecast 2021-2026 ($ billion)
Exhibit 67: Data Table on Europe – Market size and forecast 2021-2026 ($ billion)
Exhibit 68: Chart on Europe – Year-over-year growth 2021-2026 (%)
Exhibit 69: Data Table on Europe – Year-over-year growth 2021-2026 (%)
7.8 Singapore – Market size and forecast 2021-2026
Exhibit 70: Chart on Singapore – Market size and forecast 2021-2026 ($ billion)
Exhibit 71: Data Table on Singapore – Market size and forecast 2021-2026 ($ billion)
Exhibit 72: Chart on Singapore – Year-over-year growth 2021-2026 (%)
Exhibit 73: Data Table on Singapore – Year-over-year growth 2021-2026 (%)
7.9 China – Market size and forecast 2021-2026
Exhibit 74: Chart on China – Market size and forecast 2021-2026 ($ billion)
Exhibit 75: Data Table on China – Market size and forecast 2021-2026 ($ billion)
Exhibit 76: Chart on China – Year-over-year growth 2021-2026 (%)
Exhibit 77: Data Table on China – Year-over-year growth 2021-2026 (%)
7.10 Venezuela – Market size and forecast 2021-2026
Exhibit 78: Chart on Venezuela – Market size and forecast 2021-2026 ($ billion)
Exhibit 79: Data Table on Venezuela – Market size and forecast 2021-2026 ($ billion)
Exhibit 80: Chart on Venezuela – Year-over-year growth 2021-2026 (%)
Exhibit 81: Data Table on Venezuela – Year-over-year growth 2021-2026 (%)
7.11 The Philippines – Market size and forecast 2021-2026
Exhibit 82: Chart on The Philippines – Market size and forecast 2021-2026 ($ billion)
Exhibit 83: Data Table on The Philippines – Market size and forecast 2021-2026 ($ billion)
Exhibit 84: Chart on The Philippines – Year-over-year growth 2021-2026 (%)
Exhibit 85: Data Table on The Philippines – Year-over-year growth 2021-2026 (%)
7.12 United Arab Emirates – Market size and forecast 2021-2026
Exhibit 86: Chart on United Arab Emirates – Market size and forecast 2021-2026 ($ billion)
Exhibit 87: Data Table on United Arab Emirates – Market size and forecast 2021-2026 ($ billion)
Exhibit 88: Chart on United Arab Emirates – Year-over-year growth 2021-2026 (%)
Exhibit 89: Data Table on United Arab Emirates – Year-over-year growth 2021-2026 (%)
7.13 Market opportunity by geography
Exhibit 90: Market opportunity by geography ($ billion)
8. Drivers, Challenges, and Trends
8.1 Market drivers
8.1.1 Increasing demand for digital artworks
8.1.2 Growing investment in digital assets
8.1.3 Security and ownership of digital assets
8.2 Market challenges
8.2.1 Uncertainty of the NON-FUNGIBLE TOKEN (NFT) market
8.2.2 Threat from cyberattacks
8.2.3 Legal and regulatory challenges associated with the NON-FUNGIBLE TOKEN (NFT) market
8.3 Impact of drivers and challenges
Exhibit 91: Impact of drivers and challenges in 2021 and 2026
8.4 Market trends
8.4.1 Growing number of big brands entering the market
8.4.2 Emergence of fractionalized NON-FUNGIBLE TOKEN (NFT)s
8.4.3 Growing application of AI in the market
9. Vendor Landscape
9.1 Overview
9.2 Vendor landscape
Exhibit 92: Overview on Criticality of inputs and Factors of differentiation
The potential for the disruption of the market landscape was moderate in 2020, and its threat is expected to remain unchanged by 2025.
9.3 Landscape disruption
Exhibit 93: Overview on factors of disruption
9.4 Industry risks
Exhibit 94: Impact of key risks on business
10. Vendor Analysis
10.1 Vendors covered
Exhibit 95: Vendors covered
10.2 Market positioning of vendors
Exhibit 96: Matrix on vendor position and classification
10.3 Binance Services Holdings Ltd.
Exhibit 97: Binance Services Holdings Ltd. – Overview
Exhibit 98: Binance Services Holdings Ltd. – Product / Service
Exhibit 99: Binance Services Holdings Ltd. – Key offerings
10.4 Dapper Labs Inc.
Exhibit 100: Dapper Labs Inc. – Overview
Exhibit 101: Dapper Labs Inc. – Product / Service
Exhibit 102: Dapper Labs Inc. – Key offerings
10.5 Decentraland Foundation
Exhibit 103: Decentraland Foundation – Overview
Exhibit 104: Decentraland Foundation – Product / Service
Exhibit 105: Decentraland Foundation – Key offerings
10.6 FTX Trading Ltd.
Exhibit 106: FTX Trading Ltd. – Overview
Exhibit 107: FTX Trading Ltd. – Product / Service
Exhibit 108: FTX Trading Ltd. – Key offerings
10.7 Funko Inc.
Exhibit 109: Funko Inc. – Overview
Exhibit 110: Funko Inc. – Product / Service
Exhibit 111: Funko Inc. – Key news
Exhibit 112: Funko Inc. – Key offerings
10.8 Gemini Trust Co. LLC
Exhibit 113: Gemini Trust Co. LLC – Overview
Exhibit 114: Gemini Trust Co. LLC – Product / Service
About Us
Technavio is a leading global technology research and advisory company. Their research and analysis focus on emerging market trends and provides actionable insights to help businesses identify market opportunities and develop effective strategies to optimize their market positions. With over 500 specialized analysts, Technavio’s report library consists of more than 17,000 reports and counting, covering 800 technologies, spanning across 50 countries. Their client base consists of enterprises of all sizes, including more than 100 Fortune 500 companies. This growing client base relies on Technavio’s comprehensive coverage, extensive research, and actionable market insights to identify opportunities in existing and potential markets and assess their competitive positions within changing market scenarios.
Contact
Technavio Research
Jesse Maida
Media & Marketing Executive
US: +1 844 364 1100
UK: +44 203 893 3200
Email: media@technavio.com
Website: www.technavio.com/
View original content to download multimedia:https://www.prnewswire.com/news-releases/non-fungible-token-nft-market-to-record-usd-147-24-bn-asynchronous-art-inc-binance-services-holdings-ltd-dapper-labs-inc-to-emerge-as-key-vendors—technavio-301671319.html
SOURCE Technavio
Autos correspondent Pras Subramanian breaks down Wedbush analyst Dan Ives' decision to cut his price target on Tesla, as the EV developer reportedly cancels solar projects across the United States.
Elon Musk has taken on Detroit's automakers, short-sellers and securities regulators. Next week, the Tesla chief executive is set to square off in court against an unlikely foe – a thrash metal drummer who hopes to strip Musk of his $56 billion pay. The trial will pit the world's richest person against one of the electric carmaker's smallest investors, Richard Tornetta, who held just nine shares when he sued in 2018.
As Tesla’s stock rose rapidly, Mr. Musk focused on whether compensation for employees matched their contributions, and he asked a top deputy to forfeit some of his unvested equity.
(Bloomberg) — Ford Motor Co., General Motors Co., and Stellantis NV are in talks with South Korea’s Posco Chemical Co. about potentially investing in plants producing electric-vehicle battery materials in North America, according to people familiar with the matter. Most Read from BloombergMusk Warns Twitter Bankruptcy Possible as Senior Executives ExitMusk’s First Email to Twitter Staff Ends Remote WorkChina Eases Quarantine, Ends Flight Bans in Covid Zero ShiftFTX Latest: EU License Under Thre
A federal judge in Florida has imposed monetary sanctions on a team of former President Donald Trump’s lawyers, castigating them for filing a “frivolous” lawsuit against Hillary Clinton and other Democrats earlier this year. In a scathing 19-page decision, U.S. District Judge Donald Middlebrooks said a group of lawyers for Mr. Trump, led by Alina Habba and Peter Ticktin, showed a “cavalier attitude towards facts” throughout the brief history of the case. The judge, who dismissed the case in September, ordered the Trump lawyers to pay a combined $50,000 monetary penalty to the court and to reimburse a public-relations executive, Charles Dolan, for approximately $16,200 he spent defending himself in the litigation.
The energy sector has been riding high this year, with the S&P 500 Energy index up a whopping 65%. So the question for investors is, does the sector have more room to run? According to Wall Street pros, the answer to that is ‘yes.’ Selling an absolutely necessary product, energy companies are widely seen as hedges against inflation, frequently offering a combination of corporate profits and shareholder dividends. In the US, the price of crude oil has risen 15% so far this year, and the governmen
Top data center and AI chip stocks like Nvidia (NASDAQ: NVDA) took the news of expanded sales restrictions to China poorly in October. Already dealing with a falloff in consumer electronics spending, Nvidia's upward trajectory had thus far remained intact for the important data center segment. Here's what Nvidia shareholders need to know.
Twitter owner Elon Musk on Thursday reportedly reiterated his expectations about going into the office to the social media platform's staff during a meeting.
Tron founder Justin Sun’s plans to save FTX include debt, equity investments and a full takeover, he told BloombergTV on Friday, Asia time.
Shares of Unity Software (NYSE: U) were up 27% as of 12:24 p.m. ET on Thursday after the company delivered better-than-expected earnings results for the third quarter. The stock has fallen sharply this year after an internal performance problem caused revenue growth to slow with one of its advertising products and the stock is down about 80% year to date. Revenue growth accelerated over the second quarter's 9%, despite a 7% year-over-year decline in the "operate solutions" segment, where Unity offers advertising tools to help game companies monetize their games.
Several Chinese refiners have asked Saudi Aramco to reduce December-loading crude oil volumes, two sources close to the matter said, as COVID-19 restrictions and a faltering economy have weakened fuel demand in the world's biggest oil importer. The refiners sought to trim supplies for December by about half of the previous month's level, the sources said, asking not to be named because of the sensitivity of the issue. China's crude oil imports in October recovered to the level last seen in May, supported by stockpile demand at two new refineries preparing for commercial operation.
Attorney General Rob Bonta announced the lawsuit against the manufacturers of compounds that have been used in consumer goods and industry since the 1940s.
(Bloomberg) — Commodities from oil to iron ore and copper jumped after China eased some Covid restrictions, raising hopes over a demand recovery in the world’s second-biggest economy. Most Read from BloombergMusk Warns Twitter Bankruptcy Possible as Senior Executives ExitMusk’s First Email to Twitter Staff Ends Remote WorkChina Eases Quarantine, Ends Flight Bans in Covid Zero ShiftFTX Latest: EU License Under Threat as Asset Freeze Fuels CrisisSam Bankman-Fried’s $16 Billion Fortune Is Eviscera
Yahoo Finance's Brad Smith discusses top business headlines as Paul Allen's art collection brings in a record $1.5 billion, a lawsuit alleges that Apple and Amazon colluded to raise prices, and Redfin trims its workforce by 13%,
Oil and gas investor Northern Oil & Gas has been acquiring assets in key oil basins this year, with solid returns expected in 2023.
Apple supplier Foxconn plans to quadruple the workforce at its iPhone factory in India over two years, two government officials with knowledge of the matter said, pointing to a production adjustment as it faces disruptions in China. Foxconn has grabbed headlines in recent weeks, with tight virus restrictions at its Zhengzhou plant, the world's largest iPhone factory, disturbing production and fuelling concerns over the impact of China's virus policy on global supply chains.
The 13% reduction in the staff at Meta Platforms was not a surprise as tech giants have forecasted lower revenue growth as advertising dollars shrink. The CEO of Meta Platforms , Mark Zuckerberg, made the decision to lay off 11,000 of the company's 87,000 employees, but is offering over three months of severance pay and six months of health insurance coverage for those affected. "I know this is tough for everyone, and I'm especially sorry to those impacted," Zuckerberg added.
Take Fortinet (NASDAQ: FTNT), for example. Fortinet's third-quarter revenue increased nearly 33% year over year to $1.15 billion — driven by a 39% increase in product sales ($469 million) and a 28% increase in services ($681 million). Earnings per share jumped 65% to $0.33, and free cash flow was up 20% to $395 million (for a very healthy free-cash-flow margin of 34%).
Risks to global demand contributed to a decline in copper prices this year. But the value of the industrial metal may have fallen too far, as supplies look to remain tight for another decade or more.
One thing we could say about the analysts on GoPro, Inc. ( NASDAQ:GPRO ) – they aren't optimistic, having just made a…
Skip to content
Skip to sidebar
Skip to footer


0 items
-
$0.00
0